

一、部署elasticsearch集群,配置文件可“浓缩”为以下:
cluster.name: es_cluster
node.name: node1

path.data: /app/data/elasticsearch
path.logs: /app/logs/elasticsearch

network.host: 192.168.x.x
http.port: 9200
transport.tcp.port: 9201
discovery.zen.ping.unicast.hosts: ["node1", "node2","node3"]
discovery.zen.minimum_master_nodes: 2
gateway.recover_after_nodes: 3
gateway.expected_nodes: 3
gateway.recover_after_time: 5m
http.cors.enabled: true
http.cors.allow-origin: "*"
thread_pool.bulk.queue_size: 500
xpack.security.enabled: false
二、下载插件进行并进行安装
插件下载地址: https://github.com/vvanholl/elasticsearch-prometheus-exporter/releases
安装: 如果有elk单独用户,切换到该用户下, wget下载,进入到es安装目录,执行
./elasticsearch-plugin install file://$(pwd)/../../elasticsearch-prometheus-exporter-6.4.2.0.zip三、配置Prometheus, 添加如下配置,并重新启动Prometheus
- job_name: 'elasticsearch'
    scrape_interval: 30s
    metrics_path: "/_prometheus/metrics"
    static_configs:
    - targets:
      - 192.168.x.x:9200
      - 192.168.x.x:9200
      - 192.168.x.x:9200
四、配置Grafana, 导入模板
编号建议为 266 (https://grafana.com/dashboards/266) 选择数据源为 Prometheus , 添加即可
转载请注明:IT运维空间 » 运维技术 » Prometheus监控elasticsearch集群
你可能喜欢:
-
![[Oracle]复习笔记-SQL部分内容](/zb_users/upload/2023/02/25/20230213095820-63ea09bc55070.jpg)
[Oracle]复习笔记-SQL部分内容
-

oracle执行.sql文件
-

oracle 10g sqlplus,PL SQL Developer,character中文乱码解决
-

oracle跟踪sql语句
-

oracle 常用select sql语句
-

JAVA-MySQL与Oracle或者(Oracle与MySQL)之间相互拷贝数据
-

关于 mybatis-generator自定义注释生成 使用DefaultCommentGenerator重写来完成 Mybatis Generator的model生成中文注释,支持oracle和mysql(通过实现CommentGenerator接口的方法来实现)
-
如何在Oracle中一次执行多条sql语句 (.net C#)
-
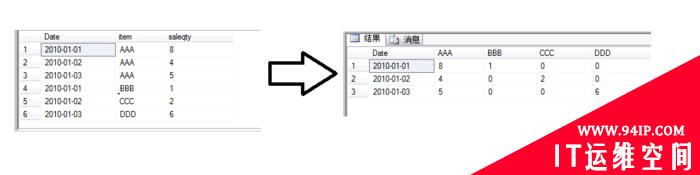
Mysql-sql行转列
-
[ORACLE]查看SQL绑定变量具体值 查看SQL绑定变量值
继续浏览有关 运维监控 的文章


发表评论